Kentucky's McVote for US Senate Pt. 2
Exploring a 2017 18% Approval Rating that led to a decisive 2020 Senate win.
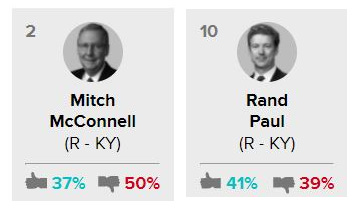
Part 2 Objectives: Understand McConnell’s 18% approval rating (from 2017) vs. his 56% election win in 2020.

Look for outliers at the district level, reviewing +10% of Kentucky's 120 counties, totaling +50% of Kentucky's 2019 overall population for a decent sample size. This is about understanding KY's trends - NOT a search for fraud, which does not have evidence of occurring.

Conclude by starting to review election security experts' writings on McConnell’s 2020 win (Alison Greene and Jennifer Cohn).
Where Part 1 looked to confirm that there were weird numbers with McConnell’s recent election (it did1), Part 2 now begins to look at a more granular level.
How much did the coattail effect play in McConnell’s 2020 win?
In other words, did most Republicans vote Republican down ballot? Or was there a spicy mix of Republicans voting for both parties - and Democrats doing the same? This data is more significant than ever given the partisan era we all exist in2.
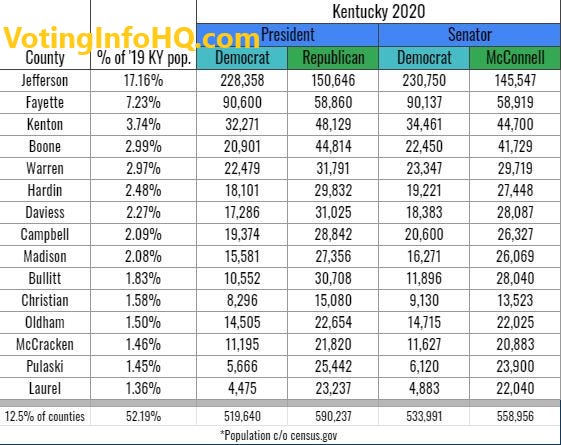
Will anything stand out at the county level with vote totals? While this review accounts for 52.19% of the population, only 12.5% of Kentucky’s counties are included (15/120). Looking at you, Democratic stronghold of Jefferson County. That said, what stands out from 2020?
*Sources for the county level vote totals provided in research below.
Observations #2 and #3 below help explain how it’s entirely possible for McConnell to have abysmal approval ratings and still win Kentucky elections overwhelmingly. Unfortunately.
Upfront, we need to talk about this popular argument that is misleading and potentially damaging to Democrats’ efforts to win at the House, state, and local levels (hear me out):
“McConnell’s 18% approval rating from 2017 means it’s impossible for him to have won more than 50% of the vote, so there must be fraud.”
That’s not accurate at all.
Occam’s Razor3, a theory I referenced last time - and personally like to consider at times - doesn’t work in this situation. If you know me4, you get why the simplicity of that theory is good for me to keep in mind - but the answer in Kentucky requires a deeper dive, with several factors considered.
Observation Deck:Seriously, though.
If Republicans can pass 361 voter suppression bills as of March 24, 20215 on the basis of the Big Lie6 AND review a certified election7 in Arizona with no oversight8 / a company with no vote auditing experience9, Democrats can go back and investigate the validity of Mitch McConnell’s elections based on the weird approval-vs-votes discrepancies (18%10).
And any Republican election win is now on the table for Democrats to investigate with dogged persistence, from past elections to future ones.
Logic framing and reframing.
It’s possible that no matter how much Kentucky voters dislike their Senators11, the majority of voters dislike the Democratic option more.
In other words, McConnell could have an 18% approval rating - but in Kentucky, the Democratic alternative would always have a 17% rating or less.
Either way, what’s the solution?
It’s up to Democrats to break through that Red wall. Messaging upgrades, infrastructure investments that are clearly provided by Democrats, and connecting with rural communities is a big deal going forward.
One of my related theories: Republicans oppose reliable internet for rural communities12 because that will make it easier for Democrats to organize in those communities, combat misinformation by breaking through that GQP message funnel, and ultimately change the hearts of some voters from Red to Blue.
Another part of this theory: This rural GQP message-funnel is a cash cow. A straight-up misinformation cash machine.
More logic framing and reframing.
It’s also possible that Kentuckians dislike all Congress members more than the average US state. Maybe they dislike government officials the most out of all of us - someone has to! Maybe the state of Kentucky just really dislikes any and all of their Senators more than any other state.

If Observations 2 and 3 are true, Democrats need to keep evolving and have a lead foot on the organizing accelerator. Right now.
If you’re in a rural community and you feel underserved by either party, I’m sorry and that needs to change. Your voice, your vote, your ideas matter.
Here are the links for the vote total sources13 I’ve been using. Alright now, let’s go!
A. Observing 2020 Voting Patterns: +50% of KY counties’ populations; +10% of KY counties.
Remember in Part 1 how Amy McGrath got 2.00% MORE votes than President Biden (38.20% vs. 36.20%), but McConnell got 4.29% LESS than the Former Guy (57.80% vs. 62.09%)? Me neither exactly, but here it is:
Now, let’s look at the county level - using a sample size that includes the population center of Jefferson county (KY’s Democratic stronghold) and several smaller Republican counties.
15/12014 Kentucky counties reviewed, or 12.5% of all counties.
52.19% of the total 2019 population (Sourced from several pages here15.)
Are there counties listed in the sample below where Biden won and McGrath lost?
No. Nothing weird like that so far.
Does anything else stand out?
Fayette County is the outlier, but it doesn’t look alarming when looking at 2020 totals:
McConnell got more votes than the Former Guy; McGrath got fewer votes than Biden - barely in both cases.
All other counties listed EXCEPT for Fayette have the combination of: 1) more votes for the Former Guy than McConnell and 2) more votes for McGrath than Biden.
It stands out to me that Kentucky Democrats showed up more for McGrath and more Republicans showed up for the Former Guy.
In the counties listed above, Biden got 88% of the vote that the Former Guy did - but the margin was much closer with McGrath getting 95% of McConnell’s total.
For a random comparison to demonstrate how close elections can get, Senator Maggie Hassan won her 2016 New Hampshire Senate election16 with 354,649 votes to 353,632. Her 2016 opponent got 99.7% of the vote total that Senator Hassan did.
It will be interesting to see how the historical voting of some counties changed in the 2020 Kentucky Senate race.
B. Reviewing Kentucky 2020 Research from Jenny Cohn, Alison Greene.
Jenny Cohn:
I agree with her findings that McConnell was expected to win the 2020 Senate race. In Part 1, I told the story of how I warned a family member to not get too excited about McGrath during the 2020 summer because McGrath wouldn’t win. Why? In part, Kentucky doesn’t like to elect women17.
Charles Booker18 will have a better chance at winning in 2022 than McGrath did in 2020. Don’t blame the messenger. Let’s understand trends like why women aren’t getting elected at high rates in Kentucky - and change the game for the better, for everyone.

This is where it gets interesting. (Let me say again clearly here - there is no expectation that I’ll find widespread fraud.) The vulnerabilities Jenny Cohn discusses are worth everyone’s time.


Alison Greene:
It looks like she started the 18% approval question - or at least drove it into the public consideration with a viral tweet. It’s a great idea to consider - I’ve devoted hours I don’t really have to spare that I can’t get back to learning about the 18%. And it’s been valuable for me, and I hope for you too as you read along with me.

I’ve addressed my feelings about the 18% approval and McConnell’s Senate win ultimately not being too alarming for me (from 2017, McConnell’s approval rating went up and exceeded McGrath’s by 2020 - like Jenny Cohn mentioned).
Right now, it’s important to immerse ourselves in understanding. There’s too much at stake in future elections, so swim deep with confidence.
Part 2 Conclusions and lingering questions.1. The style of Kentucky politics makes it completely plausible that McConnell went from an 18% approval rating in 2017 to a decisive 2020 election win.
2. Democrats need to win the rural game to go next level. Establishing a reliable broadband internet system across the country can help with that by puncturing holes in the GQP misinformation funnel / cash machine.
3. What anomalies did Alison Greene find at the county levels in December 2020 and how has that research changed the conversation on Kentucky’s 2020 elections since that was published?
4. Does the use of e-poll books in Kentucky 2020 (pointed out by Jenny Cohn) have anything to do with Alison Greene’s findings?
https://resist.substack.com/p/kentuckys-mcvote-for-us-senate-2020
https://www.pewresearch.org/politics/2019/12/17/in-a-politically-polarized-era-sharp-divides-in-both-partisan-coalitions/
https://plato.stanford.edu/entries/simplicity/
https://twitter.com/VotingInfoHQ
https://www.brennancenter.org/our-work/research-reports/state-voting-bills-tracker-2021
https://www.brennancenter.org/our-work/analysis-opinion/big-lie-and-push-restrict-voting
https://apnews.com/article/election-2020-joe-biden-donald-trump-politics-arizona-6a1ec9db67e605e37f73a780e2451f97
https://www.azcentral.com/story/news/politics/elections/2021/04/26/maricopa-county-election-audit-court-should-deny-secrecy-request-media-group-says/7387895002/
https://www.politico.com/news/2021/04/26/republicans-arizona-vote-audit-florida-484737
http://ourlivesontheline.org/wp-content/uploads/2017/08/KentuckyResults.pdf
https://morningconsult.com/senator-rankings/
https://www.rollcall.com/2021/04/13/is-broadband-infrastructure-republicans-used-to-think-so/
https://docs.google.com/spreadsheets/d/1rEaSjKE_Ju6XJ4CYYztCs6qOr_g40vRfzomc0yykiv8/edit#gid=0
https://ballotpedia.org/Counties_in_Kentucky#:~:text=Kentucky%20has%20120%20counties.
https://datacommons.org/place/geoId/21?utm_medium=explore&mprop=count&popt=Person&hl=en
https://ballotpedia.org/Maggie_Hassan
https://women.ky.gov/Legislation/Pages/default.aspx#:~:text=In%20Kentucky's%20history%2C%20no%20woman,women%20throughout%20history%20to%20Congress.
https://www.wlky.com/article/former-ky-rep-charles-booker-forms-exploratory-committee-for-2022-senate-run/36094953


